Live Events
Outdoor Advertising reaches 98% of the US population every week.
We design campaigns that do more than catch eyes—they drive action: every $1 spent on OOH returns nearly $6 in product sales, and almost half of consumers search for a brand online after seeing an ad⁽⁵⁾.
Whatever your campaign goals—brand awareness, foot traffic, website visits—we deliver standout OOH solutions that outperform. If it can be done better, we’ll do it. Don’t follow the crowd—join it!
2026 LAS VEGAS EVENTS
NEW EVENTS COMING SOON VEGAS BE ON THE LOOKOUT!

2026 WORLD CUP MEXICO – UNITED STATES – CANADA
.
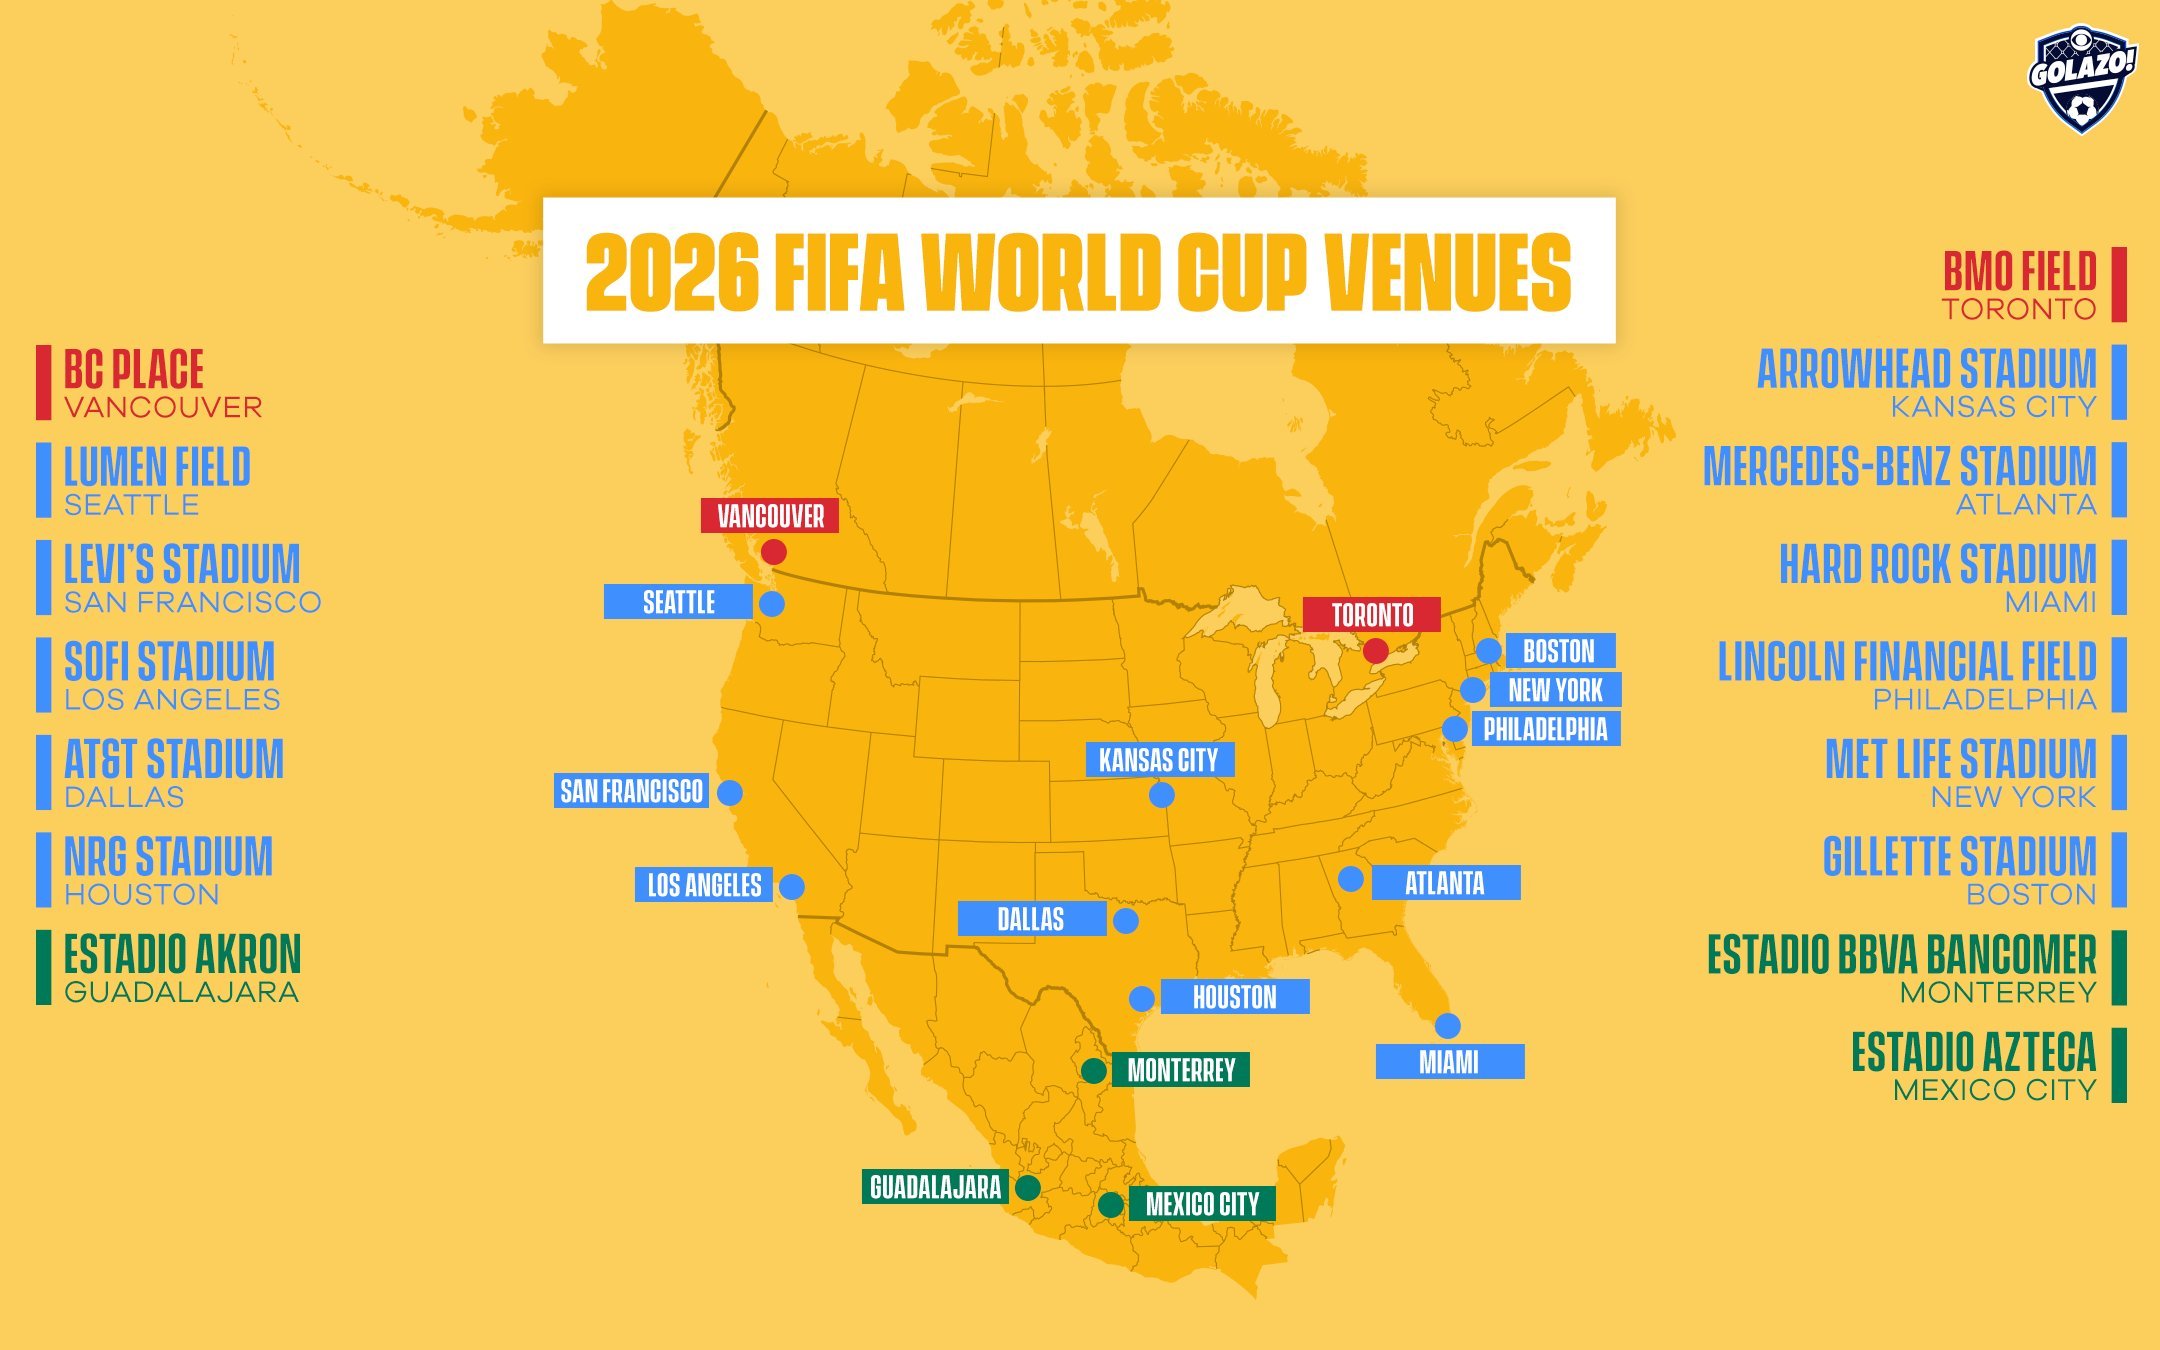
FIFA World Cup 2026 Host Market Opportunity

Estimated Economic Impact by Host Region
The United States hosts the majority of 2026 World Cup match inventory, creating a concentrated advertising opportunity across tourism, transit, nightlife, hotel, airport, fan-zone, and rideshare corridors.
U.S. Match Inventory
78/104
World Cup matches hosted in the United States across 11 host-city regions.
11
U.S. host city regions with major tourism and media activity.
$160M–$620M+
Typical estimated impact per U.S. host city, depending on match count and market scale.
3.8M
Estimated visitors expected in Dallas during the event window.
June–Aug
Peak campaign window for brands targeting World Cup-driven travel and attention.
Top Host-Market Impact Snapshot
Match count drives exposure density, but campaign value also comes from tourism flow, hotels, airports, rideshare movement, nightlife, fan zones, and event-day congestion.
Dallas
9 MatchesHighest match count + major visitor concentration
$1.5B–$2.1B
New York / New Jersey
8 MatchesGlobal media market + dense transit movement
$1B+
Boston
7 MatchesRegional tourism lift + premium sports audiences
$1.1B Regional
Los Angeles
8 MatchesEntertainment, tourism, airport, and premium reach
~$892M
Miami
7 MatchesInternational travel, nightlife, hotels, and airports
~$500M–$800M
Atlanta
8 MatchesMajor Southeast travel hub + event-day mobility
~$500M–$800M
U.S. Host Region Opportunity Table
Economic Impact + Campaign Signal
| Host Region | Matches | Estimated Impact | Campaign Signal |
|---|---|---|---|
| Dallas | 9 | $1.5B – $2.1B | Highest match count; major visitor concentration. |
| Los Angeles | 8 | ~$892M | Entertainment, tourism, airport, and premium consumer reach. |
| New York / New Jersey | 8 | ~$1B+ | Global visibility, dense transit, hotels, and media attention. |
| Atlanta | 8 | ~$500M – $800M | Southeast travel hub with strong event-day mobility. |
| Miami | 7 | ~$500M – $800M | International tourism, nightlife, hotels, airports, and beaches. |
| Seattle | 6 | ~$400M – $700M | Tech, tourism, stadium traffic, and regional fan movement. |
| San Francisco Bay Area | 6 | ~$400M – $700M | High-value audiences across tech, travel, and business corridors. |
| Houston | 7 | ~$500M – $900M | Large metro reach with strong airport and hospitality activity. |
| Kansas City | 6 | ~$400M – $600M | Concentrated fan zones and regional drive-in attendance. |
| Philadelphia | 6 | ~$400M – $600M | Historic tourism, transit corridors, and dense urban movement. |
| Boston | 7 | ~$1.1B Regional | Regional tourism lift with premium sports and business audiences. |
Strategic takeaway: World Cup 2026 will create a temporary surge in concentrated consumer attention. Mobile OOH campaigns can follow demand across stadium routes, hotel districts, airports, nightlife zones, restaurants, fan activations, and high-traffic rideshare corridors.
Turn World Cup traffic into measurable brand visibility.
Use wrapped rideshare and delivery vehicles to reach fans where static billboards cannot: moving through hotels, airports, restaurants, fan zones, and event-day traffic.